Are Stats Science Based or Not?

Statistics is a version of mathematics concerned with collecting, interpreting, analyzing, and presenting data. People can use it in many academic areas, including the physical and social sciences, sports stats, and general humanities. People use statistics to help make better judgments.
Stats are not science-based in one sense because you cannot prove anything definitively through statistics.
No proof can be a good or bad thing, depending on the subject of the stats. For example, if someone is trying to entice you to purchase something, it will likely be in their best interest to have “scientific” proof that their product works best.
Using stats in this way isn’t always true, but companies use stats to sell products.
Looking at the problem differently, there are many cases where statistical methods collect information about things people can’t directly observe, such as homelessness or infidelity in marriages. Because these kinds of things typically aren’t observable, scientists must make conclusions based on data found through surveys and studies which produce numbers instead of actual observations.

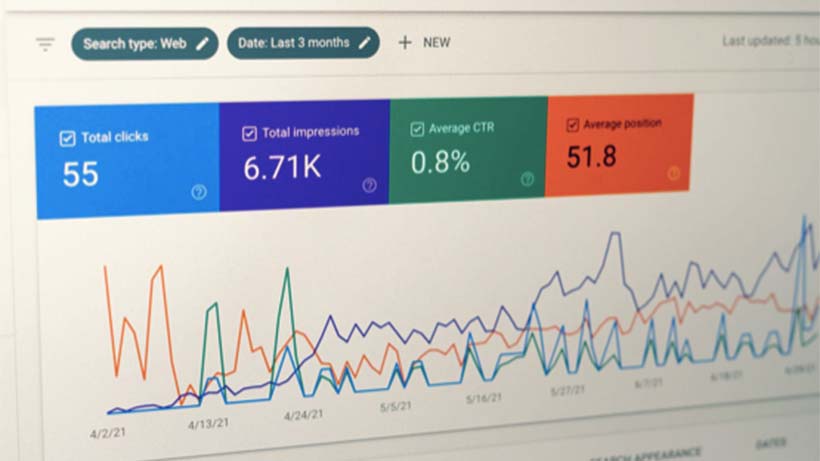
Photo by Justin Morgan on Unsplash
Stats help make informed decisions
People can use statistics to make informed decisions. For example, if you are viewing several prospective homes for purchase, statistics can help guide your decision by presenting the essential information about each house available for sale.
Considering many different aspects is vital when making a home-purchase decision, including variables such as location, price, number of bedrooms and baths, age of the home, etc. If each variable—price, number of bedrooms, and baths—is represented graphically, it is much easier to determine the best choice for your family.
You would want to choose the home with the highest total score based on factors representing your needs in a new house (e.g., size). The other alternative is deciding between these homes using different measures. For example, if your top priority is having a large yard, you might choose the home with the more considerable lot.
If people took this approach instead of using statistics to make an informed decision, it would be much more time-consuming and challenging to compare several homes based on different variables.
There are different types of statistics, and they have other uses, as explained below.
Descriptive statistics
When describing or summarising data acquired from a sample of possible observations, descriptive statistics come into play.
A critical component in determining if descriptive statistics are helpful for generalization purposes is how representative the sample data is of those studied. Descriptive statistics give essential insight into the relationships between various characteristics or attributes of individuals or objects in the study.
When using descriptive statistics, it is essential to recognize that not all data is created equal. It varies depending on the variable(s) measured, the number of observations, location of observation(s), and reliability of measurements.
Additionally, these characteristics will vary depending on where you take your measurements. It is always best to check out the environment before taking any measurements or making any observations within that environment. You would not want to measure water temperatures in a river close to a nuclear plant meltdown. The results could be misleading because too many uncontrolled variables interfere with your measurement process at this particular place and time.
Limitations
There are a few limitations when using descriptive statistics. As with any form of statistical analysis, it is vital to highlight the limits of the data analysis.
The same goes for statistics in general. Even though statistics can provide us with great insight into our world or environment, there will always be measurable or observable theoretical limits to such analysis (e.g., you cannot measure an infinite number).
When observing and measuring, you will never get an exact result; however, you should strive to obtain accurate results within the range of possibilities (e.g., ± 5%).
We often do not have all the information needed to make informed decisions due to missing data (e.g., we need more variables).
While there are also some benefits to using descriptive statistics, it is vital to remember that, by nature, it does not allow for the analysis of relationships between variables. For example, you cannot tell if there is an association between stress levels and frame of mind by simply observing one or both factors alone.
Theoretical models can help us understand how two factors might be related in a cause-and-effect relationship by multiplying their individual effects together. Still, this method is often limited as well.

Experimental stats
Experiments are also another form of stats helping us make informed decisions. Experiments involve testing a single event or independent variable’s effect on the subject(s) or object(s). There can be more than one factor, and they may interact with each other and the independent variables.
An experiment is trying to answer just one question: what will happen if I change this one thing? A good example would be seeing how participating in an exercise program would affect the heart rate after eating a meal.
Another example would be studying whether having a good frame of mind helps lower stress levels. These studies test one relationship between two factors (the dependent and independent variables). Still, people can also use them to test two different types of relationships between two or more elements (the dependent and independent variables).
Suppose the data being used has been gathered with care. In that case, it generally provides us with accurate information about what happened in reality and the time where participants took the measurements.
People can use this information to make informed decisions regarding the target population (e.g., what percentage of people with X condition are likely to experience an outcome). The data can also be aggregated over time or space, allowing for comparisons between different groups or events.
However, it’s essential to remember that this form of research has limitations because it doesn’t allow us to infer behavior (i.e. how things work). After all, we’re examining two types of relationships: association and causality.
The data types used in statistical analyses are samples selected from a population to derive information about the target population.
An unbiased and random selection of representative participants is needed to construct a valid representation of the population under study.
Conclusion
The information gathered from a statistical analysis does help us make decisions regarding a particular topic or issue while also providing insight into how things work within our environment. However, it’s important to remember that there are limitations on what we can measure and observe, which will vary depending on the specific situation at hand.
Also, remember that descriptive statistics can only provide information about what already happened rather than predicting future events based on past experiences.
When adding statistics to your argument, you use documentation that supports your viewpoint consistent with the evidence you have gathered, making it easier for others to understand what you mean because statistics can be tricky.


